DECODING
THE FINANCIAL MATRIX.
A quantitative engine that computes, ranks, and analyses valuation across global markets.






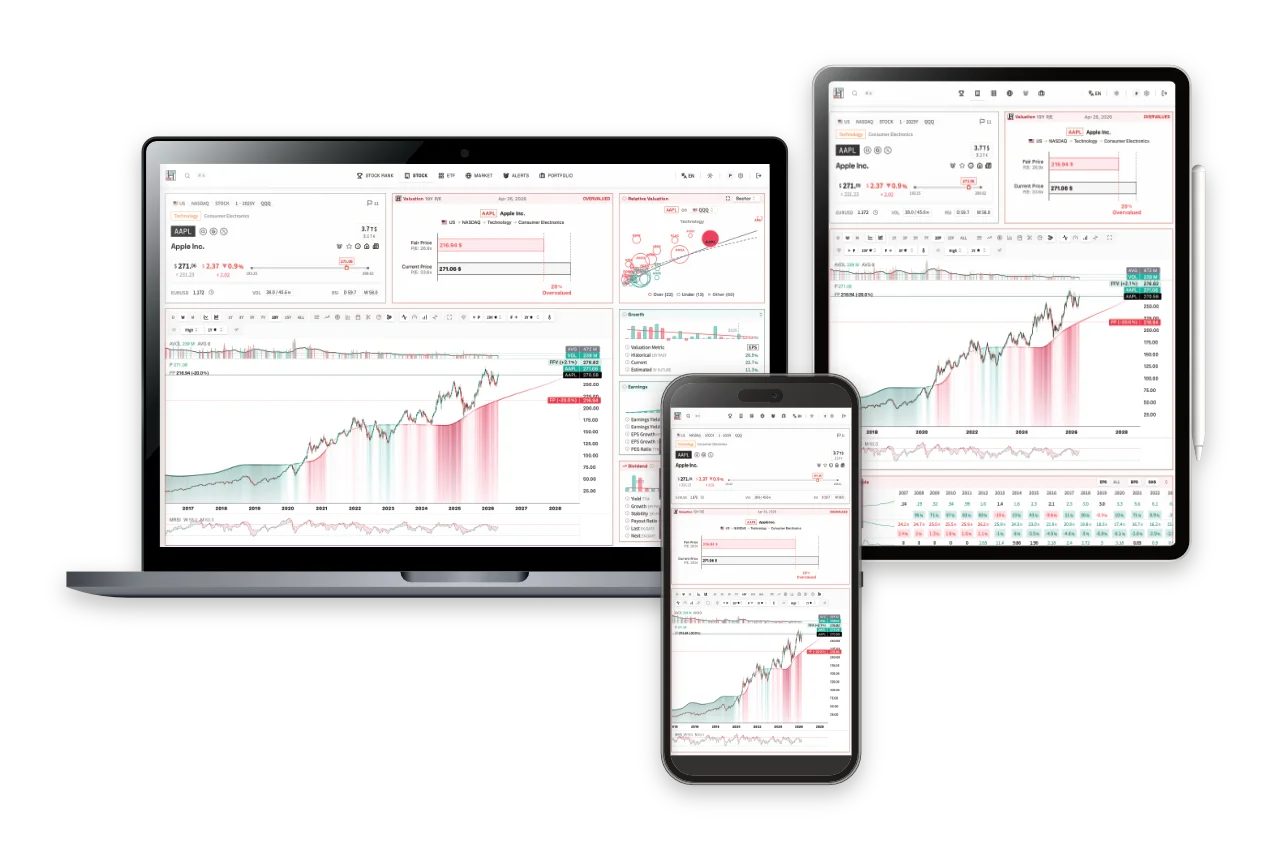
 https://hedgehammer.com
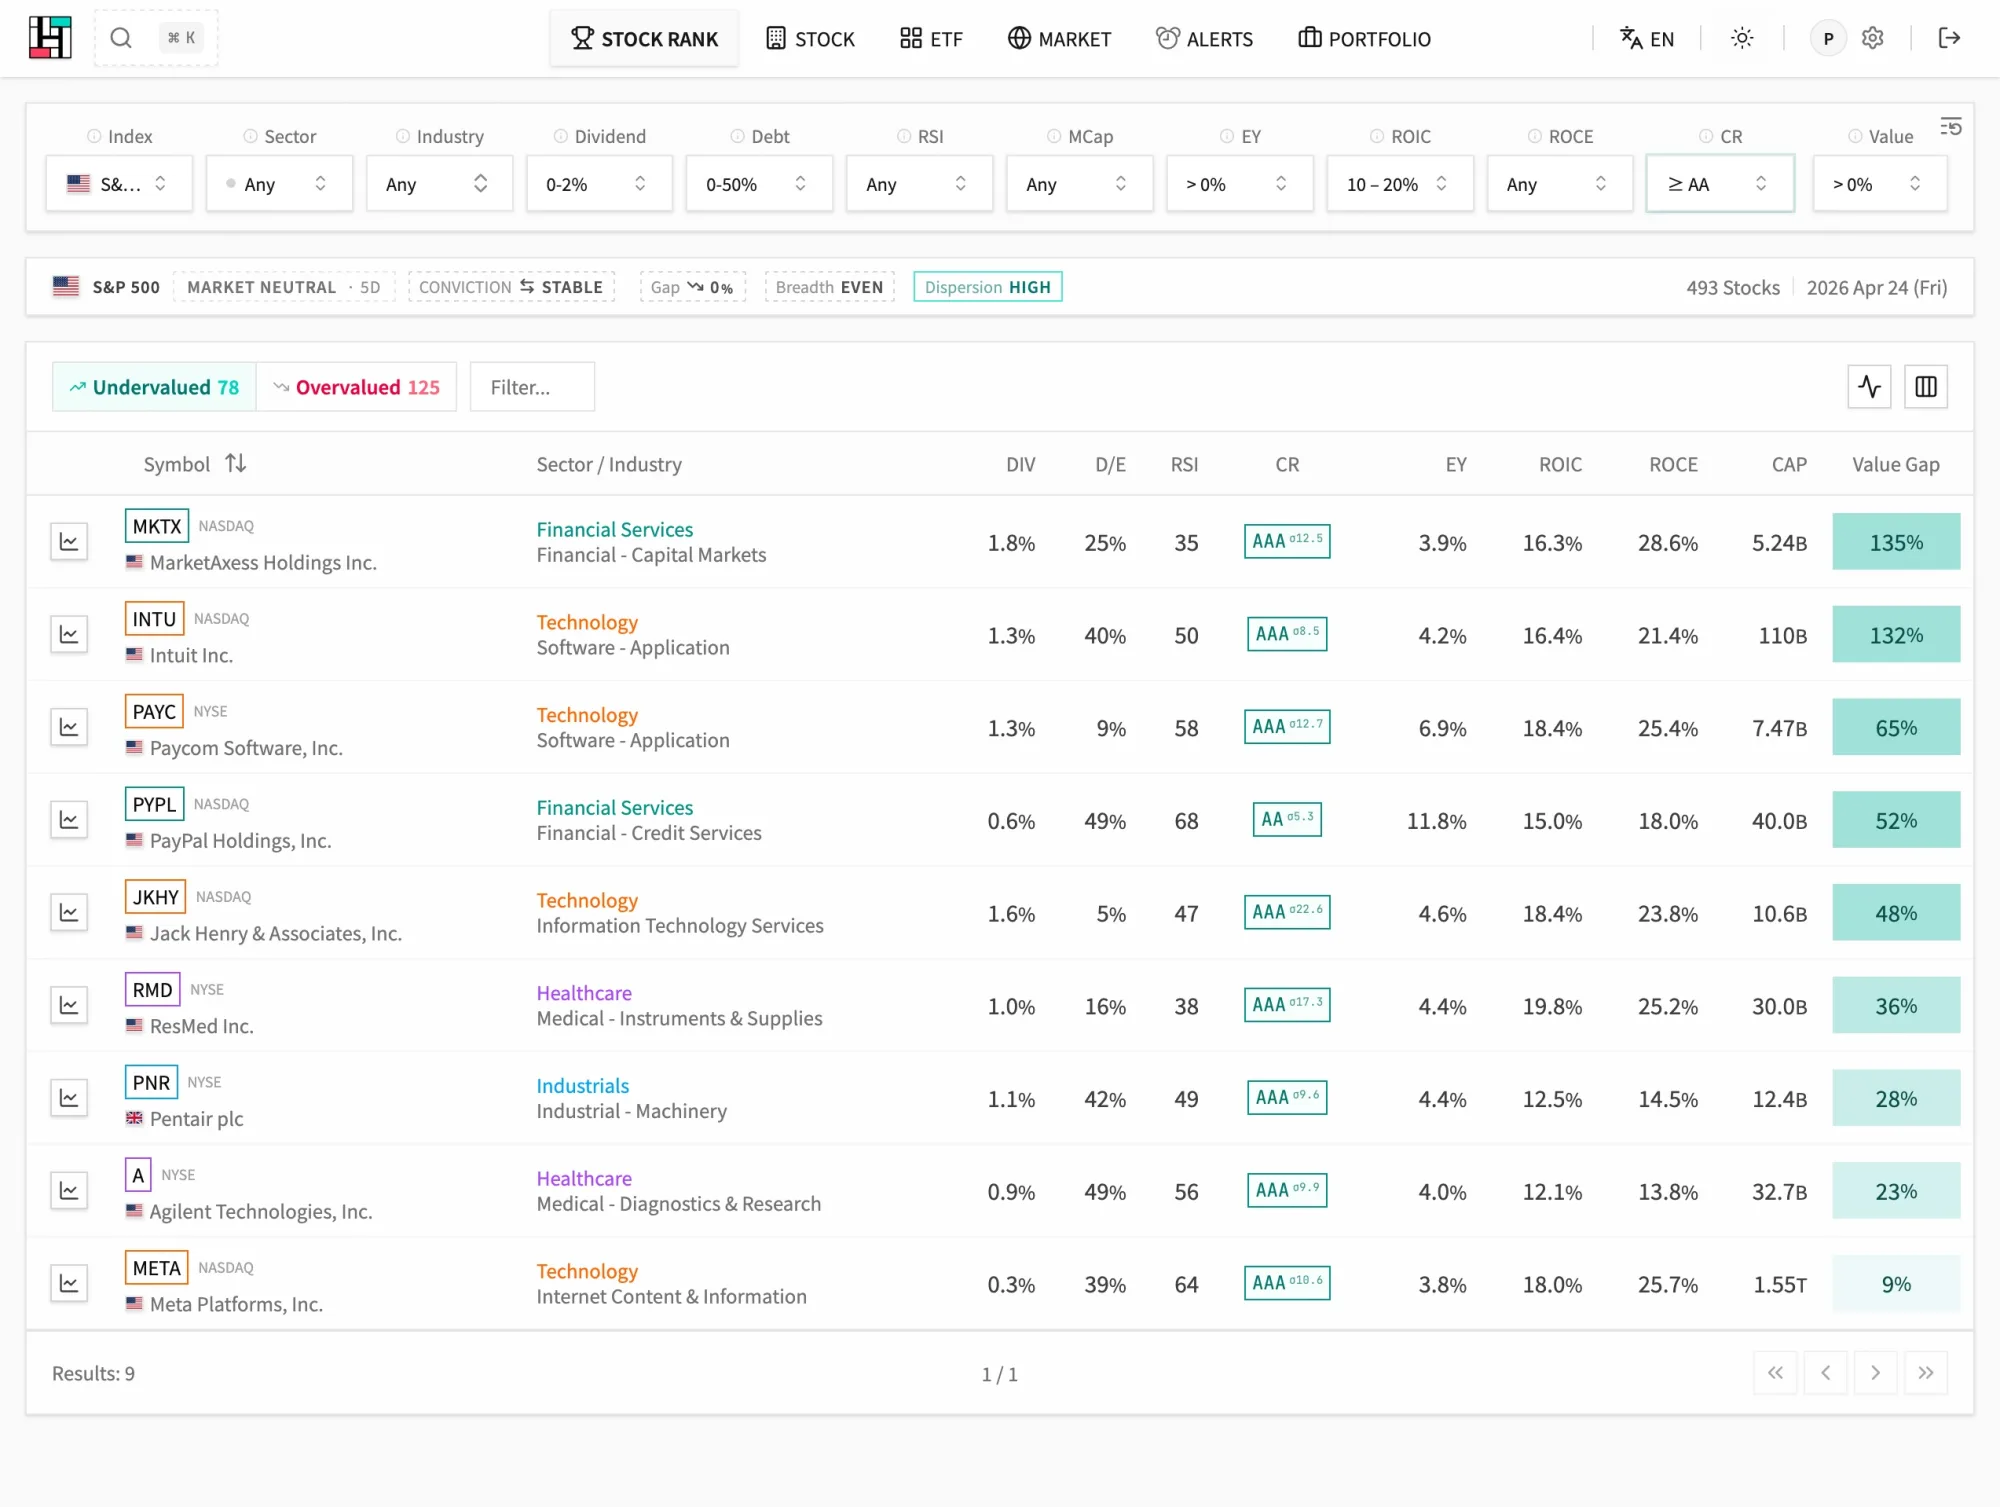
Identify and rank stocks across global markets.
https://hedgehammer.comComputational valuation for stocks.
https://hedgehammer.comComputational valuation for ETFs.
https://hedgehammer.comTrack and manage portfolios.
https://hedgehammer.comMarkets, economic calendar, earnings & dividends.
https://hedgehammer.comRRGs for sectors and more, all at a glance.
https://hedgehammer.comMarket health: breadth, VIX signals, and trend alerts.
https://hedgehammer.comFactor exposure matrix across portfolio holdings.
https://hedgehammer.comFactor space: visualise risk clusters and correlations.
https://hedgehammer.comPortfolio vs. benchmark factor decomposition.
COMPUTATIONAL VALUATION
THEMATRIXENGINE
Quantitative intelligence that extracts structure from complexity.Not a chatbot. Not a conventional valuation model. The Matrix Engine combines multiple quantitative dimensions into a computational valuation framework built to reveal relationships, dislocations, and uncertainty that traditional models miss.
ONE ENGINE. TWO WAYS TO USE IT.
The Matrix Engine powers everything. Use it however you work.
Web App
The full picture, in one platform.
Explore valuation, rankings, portfolio risk, and market intelligence visually — all in one place. Built for investors who want to go beyond price.
- › Computational valuation across thousands of stocks and ETFs
- › Relative ranking and sector comparison tools
- › Portfolio risk, factor exposure, and drawdown analysis
- › Earnings, dividends, and fundamental data at a glance
- › Market health, sector flows, and macro indicators
KEY FEATURES
Filterable Rankings
Rank and filter thousands of securities across global markets and sectors to discover value.
Relative Mispricing
Compare companies and markets to surface valuation dislocations and relative-value opportunities.
Probabilistic Forecasting
Explore distributions and probability-weighted scenarios instead of relying on a single price target.
Portfolio & Risk Intelligence
Understand exposure, concentration, drawdowns, and the underlying risk factors driving your book — with real-time factor decomposition.
Volatility Structure
Decompose weekly upside and downside volatility with distributions, frequency, extremes, and streaks.
Market Regimes
Detect shifts in market structure, breadth, streaks and valuation dispersion as conditions change.
Early User Feedback
HedgeHammer doesn't just show me data, it helps me understand an asset's DNA. It's a completely different way of looking at price action.
Institutional-grade analytics made for humans. It's become the central hub for my investment research, alongside my broker for execution.
The global rankings are fast and genuinely useful. I've found non-obvious opportunities there well before seeing them mentioned in financial media.
I was sceptical that another tool could tell me anything new. Instead, it surfaces valuation gaps that used to take me hours to find manually.
Comparing relative mispricing across global markets used to be tedious. HedgeHammer does it almost instantly and makes opportunities much easier to spot.
Portfolio risk systems can cost hundreds of thousands a year. HedgeHammer brings sophisticated portfolio analytics to independent investors at a fraction of the cost.